3 Examples to Reduce Your Carbon Footprint and Cut Manufacturing Costs
Key Takeaways:
- Manufacturers can veer off the path to product sustainability and profitability without the right data
- Three case study examples highlight hidden and counterintuitive opportunities to reduce product manufacturing CO2e
The Full Article:
Many manufacturers have established aggressive goals to reach net-zero emissions. Understanding how to reduce the embodied carbon in existing parts and new designs is pivotal to achieving corporate sustainability goals and addressing climate change.
To address today’s market needs, aPriori enables manufacturers to assess design and production changes across sustainability, cost, and manufacturability simultaneously. With this granular level of detail, teams can compare design, manufacturing, and sourcing options and make data-driven decisions quickly and confidently.
Fact-based insight is essential – especially because some data-driven recommendations may seem counterintuitive if detailed information isn’t available to inform decision-making.
The following three case study examples showcase the interplay between costs and carbon emissions in the discrete manufacturing industry.
Example 1: How Does Factory Location Affect Your Cost and Carbon Footprint?
A side panel for a car is currently manufactured in Eastern Europe in this first example. The sourcing team is evaluating the following locations in an effort to reduce manufacturing costs and/or carbon: China, Eastern Europe, Western Europe, and the United States. The team needs to understand the trade-offs to evaluate regional manufacturing effectively.
To evaluate its options, the sourcing team uploads the 3D CAD model of the side door panel into the aPriori digital factory and enters the following specifications:
- Material: ABS
- Production process: Plastic molding
- Annual volume: 5,000
- Production duration: Five years
The current baseline cost from Eastern Europe is $16.85 per unit and 8.3 kilograms of carbon emissions, which is evenly split between material and process CO2e. Now, the sourcing team compares greenhouse gas emissions (GHG emissions) across various regions.
Learn more about aPriori’s Regional Data Libraries.
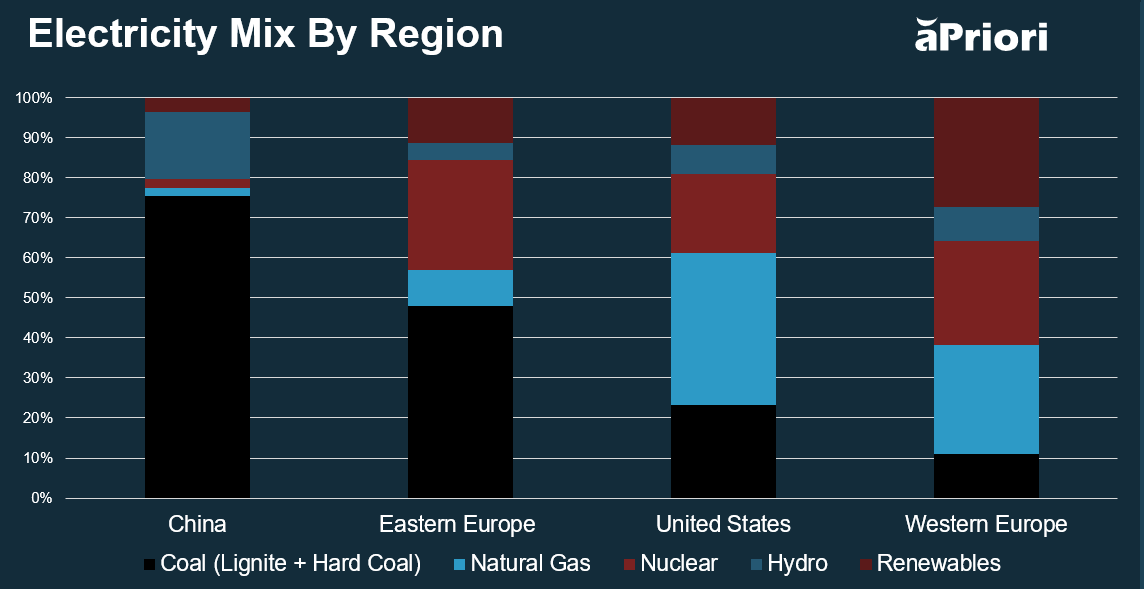
Figure 1: Energy Mix Comparisons by Region
Figure 1 shows the mix of energy sources, including coal, natural gas, nuclear energy, hydropower, and renewable energy in each region’s energy use. China, producing about 75% of its electricity from coal, has the highest CO2e emissions per kilowatt-hour. By contrast, Western Europe has the lowest emissions because its energy mix only includes 12% coal.
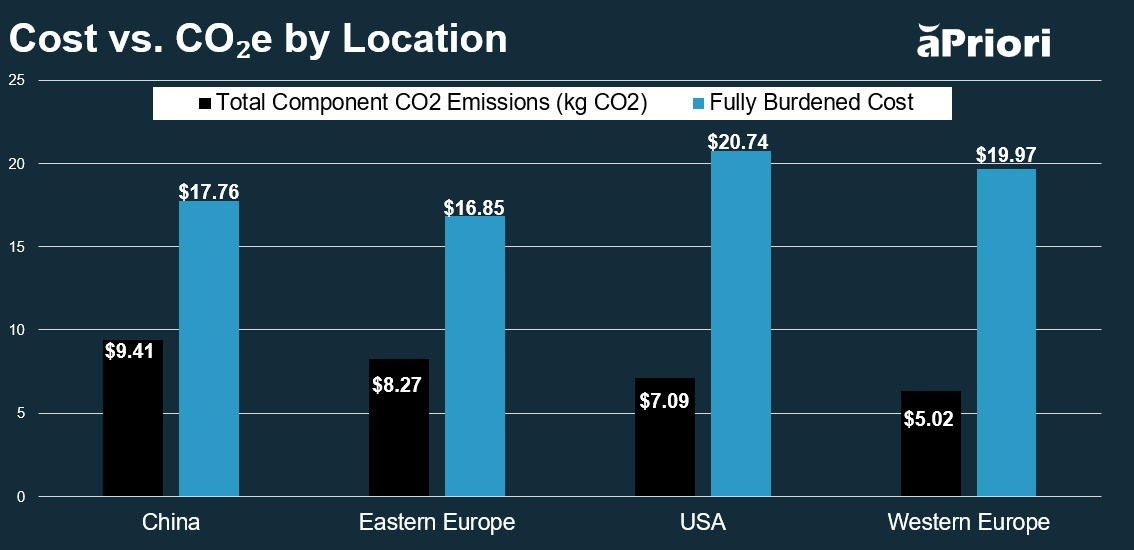
Figure 2: Comparing Cost and CO2e Emissions by Region
The carbon impact for each location varies significantly. Companies can start to make these trade-offs and better understand the strategic value of saving 1.3 kilograms of CO2e by moving production to the United States and increasing the production cost by nearly $4 per unit. The company can determine the best path forward based on its profitability and sustainability targets.
When considering cost and carbon using aPriori analysis, Eastern Europe is preferable to China because both the environmental impact and cost are lower. But depending on the company’s priorities, Western Europe may be the preferred production region based on its mix of cost and carbon.
Example 2: The Impact of Material Choices on Carbon Emissions
For an electric vehicle control unit connector, choosing between different materials can bring surprises in terms of carbon footprint. For the plastic housing of this assembly, the manufacturer is comparing Nylon 6 and Nylon 6 with a 30% glass fill to look at the differences between the two materials. The component assumptions and specifications are the same for each material:
- Component/CAD model: Electric vehicle control unit (EVCU) connector
- Production process: Plastic molding
- Factory location: United States
- Annual volume: 5,000
- Production duration: Five years
First, let’s establish a baseline to base our assumptions using data from ecoinvent, aPriori’s life cycle inventory database (LCI) / life cycle assessment (LCA) partner. LCI data shows that Nylon 6 has 9.27 CO2e per kilogram, while its glass-filled counterpart has 7.43 CO2e per kilogram – 20% less than Nylon 6, which is a much lower carbon intensity.
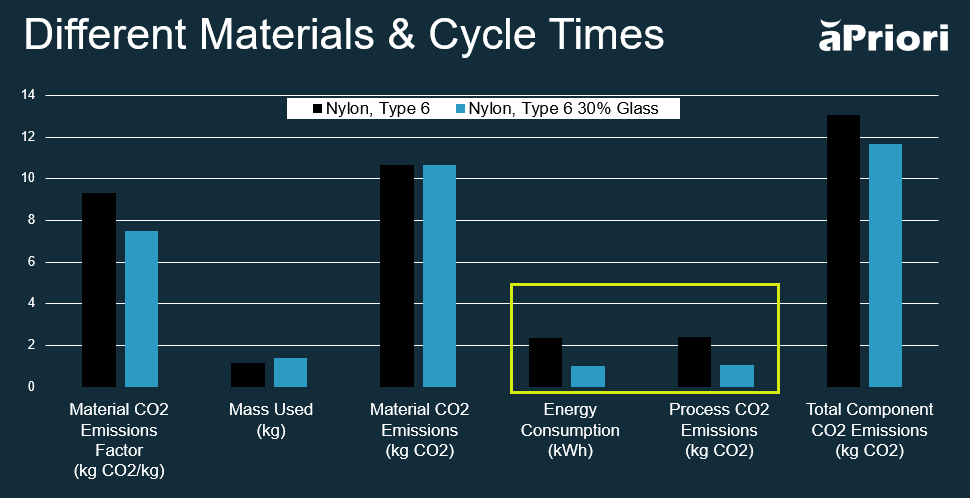
Figure 3: How Manufacturing Cycle Time Can Impact CO2e
The product design team assumed that trying a glass-filled Nylon 6 may offer an improvement, as the glass-fill usually leads to faster cooling times, which reduces energy used during production. When you look at the data in isolation, the glass-filled nylon appears to have lower CO2e per kg.
However, because the material is also more dense, the same design (i.e., the same volume of material) will be heavier, so it is not an accurate apples-to-apples comparison. CO₂e by volume of material is similar for both options. But running the manufacturing process simulation through aPriori proved the design team’s assumption: the cooling time was reduced, leading to much lower process carbon but virtually identical material carbon.
Financially, this also translates to a cost reduction of about 10%, from $16.40 to $14.48. The glass-filled Nylon’s stiffer properties also allow potential design modifications, such as reducing the sidewall thickness. This could lead to less material required (less volume), and thinner walls could mean even faster injection and cooling times.
This points to the importance of iterative design processes in manufacturing. Manufacturers can make more informed and sustainable decisions by optimizing material choice and understanding its impact on both carbon emissions and costs.
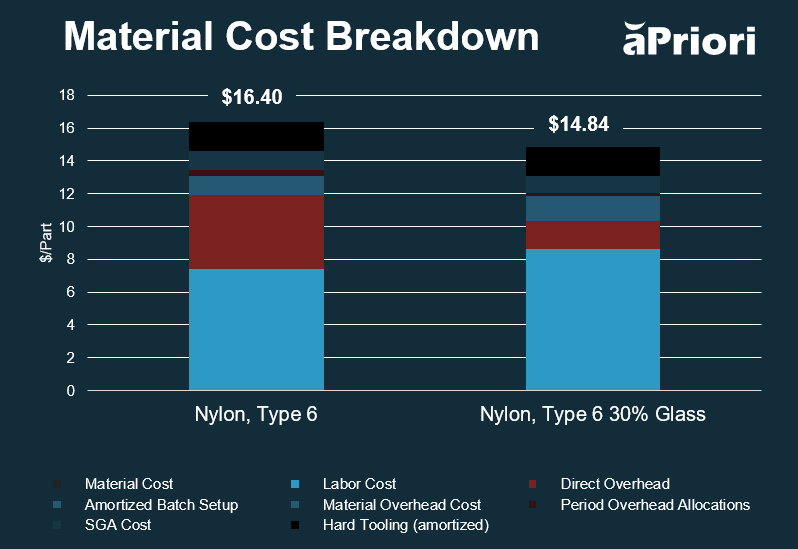
Figure 4: Comparing Costs for Nylon 6 vs. Nylon 6 – 30% Glass
Example 3: The Manufacturing Process and Carbon Implications
Finally, the third example examines the carbon emissions difference between die casting and machining. We’re using the same part in the previous example, but now we are evaluating the part’s metal component (produce 5,000 components annually for a five-year period).
Die casting for this component provides a significantly lower cost and carbon footprint. Production volume is a central factor here: it’s typically cost-prohibitive to die-cast low-volume parts. Due to the type of part and volume, it’s approximately nine times more to machine it.
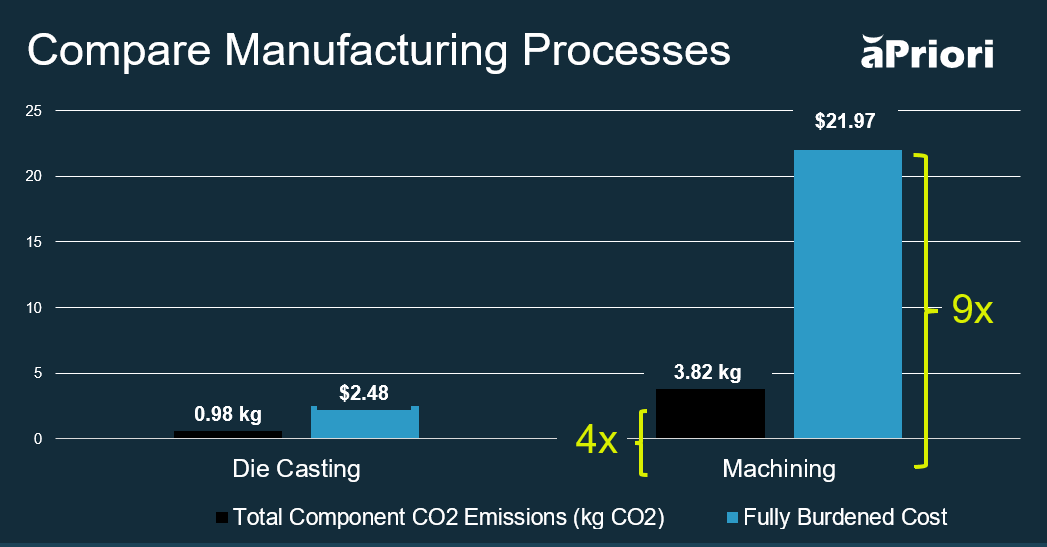
Figure 5: Die Casting vs. Machining (Cost and Carbon)
The machining process also has a significantly higher CO2e component than die casting. Die casting is much more material efficient, so less is needed overall despite requiring more energy to melt and pour the metal versus machining, which mills out a machined part.
The biggest CO2e driver for this part stemmed from its material carbon. The process uses aluminum billet, which requires more processing than aluminum ingots. The biggest factor, however, is the amount of waste associated with machining, which wasted about 68% of the original aluminum stock.
With this understanding, manufacturers can consider ways to modify the product design or how the material is used in production to reduce waste. Or focus on opportunities to increase material utilization. This example shows how waste – especially with metal parts – can increase a product’s CO2e exponentially.
Use Insights – Not Intuition – to Reduce Your Carbon Footprint
The journey to manufacturing sustainability is rife with complexities. Real-time data is a critical element in developing an effective methodology to identify and mitigate emissions based on energy-intensive manufacturing processes and raw materials that are high in carbon But by analyzing every step of design and production, manufacturing teams can uncover opportunities to reduce costs and minimize the carbon impact during design and throughout the supply chain.
As our three case study examples indicate, detailed insight into the manufacturing design and production lifecycle is required to gather and analyze all relevant data to strike the right balance for a sustainable future. And aPriori provides real-time insights for manufacturers to evaluate, reduce, and help to report on the carbon footprint of their products.
Frost & Sullivan Names aPriori the Digital Manufacturing Solutions Leader
Get the story behind the award.