Resources Hub


Steps to Calculate Total Manufacturing Costs by Region

Xuanjiang (William) Liu
— January 9, 2024
Listen to this Article
1×
00:00
00:00
Key Takeaways:
- It’s challenging to estimate manufacturing costs accurately. Use our collection of common (and sometimes overlooked) cost formulas and reliable resources to improve manufacturing cost estimation across different regions.
- Learn how manufacturers use aPriori’s automated software to compare factory costs globally.
Full Article:
Where will economic and geopolitical pressure likely rupture your global supply chain? And does your supplier network have the resilience to navigate myriad risks facing manufacturers?
Those are some of the key questions facing manufacturers today. United Nations Conference on Trade and Development (UNCTAD) cites inflation, trade restrictions (including climate-related trade regulations), and “lengthening” supply chains as the biggest threats to global trade and manufacturers’ profits.
Proactive manufacturers are using the latest economic and sustainability data to calculate manufacturing costs by region and plan effectively. This post lists common and sometimes overlooked costs required to establish accurate manufacturing cost estimates across different regions.
We also include a list of reliable data sources to help ensure that average costs are current and reflect differences by country and area. This data is critical to make informed decisions about where to locate production facilities, source materials, and allocate resources. To accelerate this process, aPriori provides manufacturers with detailed and accurate manufacturing cost information in nearly 90 regions for real-time analysis and decision-making.
Read the following sections to help you estimate and compare manufacturing costs across the globe:
- How to Calculate Total Manufacturing Costs by Region (Including Labor Rates, Overhead, and Materials)
- aPriori’s Global Manufacturing Cost and Sustainability Libraries
- Resources for Manufacturing Cost Data
- Formulas to Calculate Manufacturing Costs
- How to Use Regional Cost Insights as a Competitive Advantage
1. How to Calculate Total Manufacturing Costs by Region
Total manufacturing costs include regional labor rates, manufacturing overhead (direct and indirect overhead expenses, toolshop rates, etc.), and material costs. These expenses can vary significantly (e.g., labor rates can fluctuate by region, skill level, and manufacturing sector).
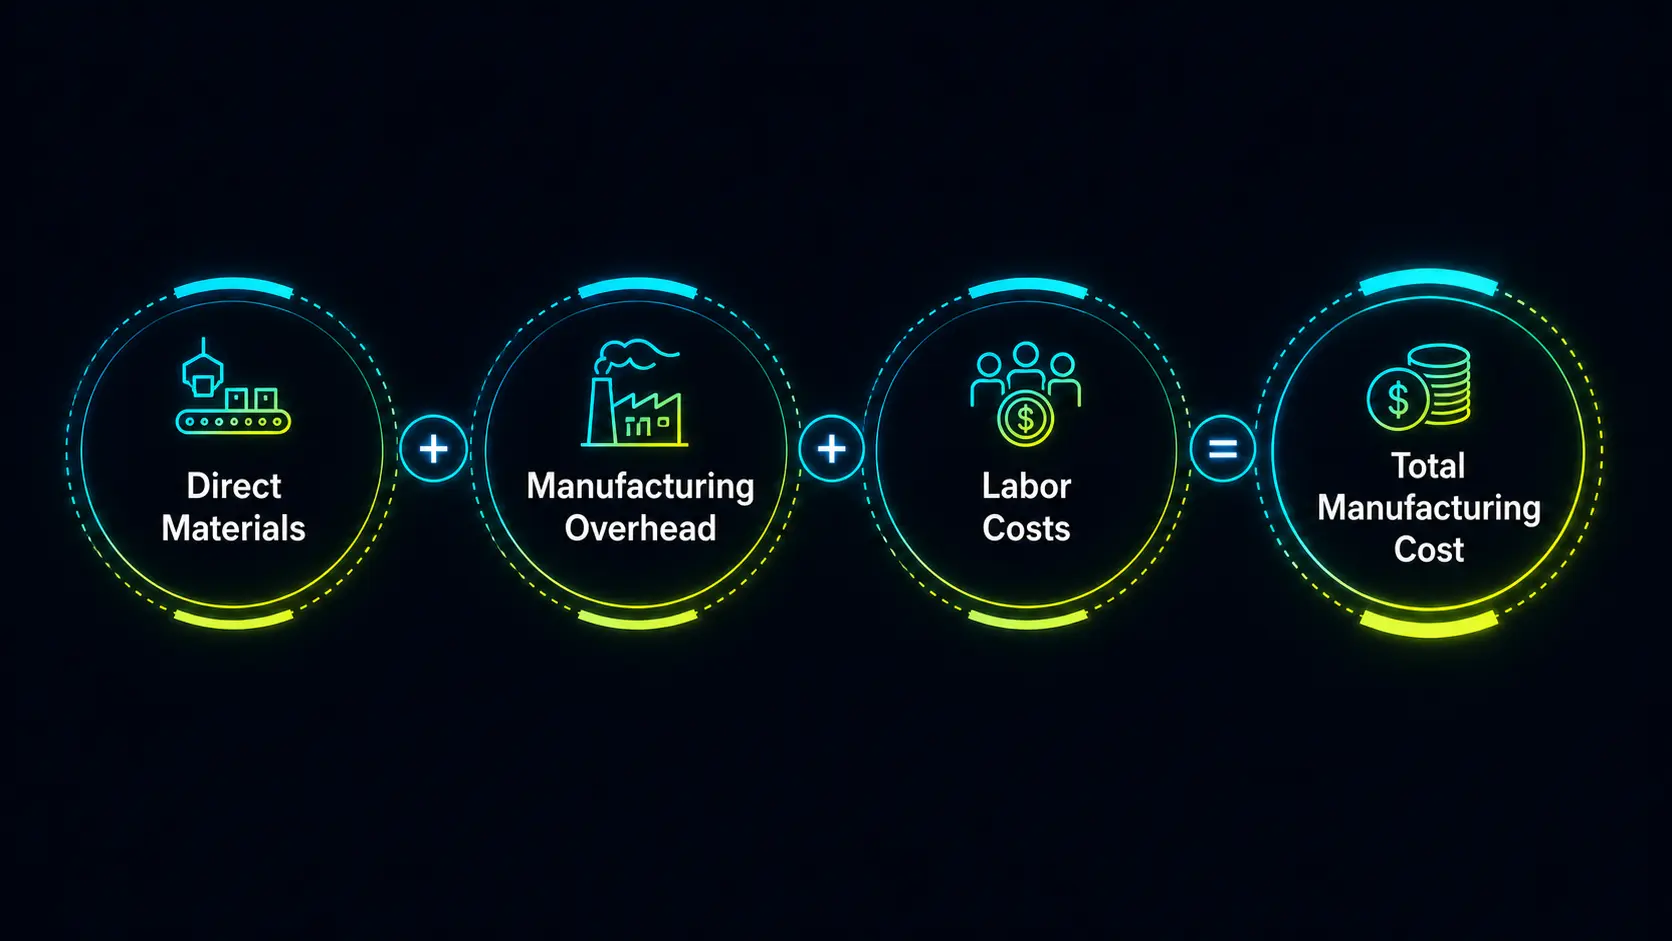
In its simplest form, the formula to determine total manufacturing costs is: Labor Costs + Manufacturing Overhead + Direct Materials = Total Manufacturing Cost.
Below, we’ve provided additional definitions, formulas, and background to help address the two main challenges to developing accurate manufacturing cost estimates:
- The granular level of detail required to capture so many economic variables globally; and
- Inflation and other pricing volatility factors make it difficult to gather up-to-date cost information in multiple manufacturing regions.
How to Calculate Regional Manufacturing Labor Rates
aPriori’s fully burdened labor rate includes direct wages, directly paid benefits, and social overheads. For each process in each region, aPriori uses the following equation to determine labor rates: Direct Wage x Direct Benefits Factor x Social Insurance Factor = Fully Burdened Labor Rate. Additional labor rate factor definitions and background information follow below.

The Direct Wage is determined for each process based on the region, skill level, and industry. A direct wage includes all employee compensation – including basic wages, piece rate, and bonus paid each pay period. Accurate direct wage calculations should address variables including:
- Regional labor rates: Because wages vary across China, Japan, India, and other industrial countries, regional data is required for precise wage estimates
- Skill levels: Weight wages based on experience, certifications, training, and related factors required for various manufacturing environments
- Manufacturing process groups: Consider the specialized expertise (and associated wage pressure) in the following types of production:
- Metal (including assembly, bar & tube fab, composites, forging, heat treatment, machining, part assembly, powder metal, sheet metal, stock machining, and surface treatment)
- Plastic (including composites, PCB, plastic molding, powder metal, roto & blow molding, and sheet plastic)
- Casting (casting electronics)
- PCB fabrication (including PCB assembly and wire harness)
- Industry: Weight labor costs by industry to further refine wage estimates. aPriori sets wage grades for the following six manufacturing sectors:
- Aerospace
- Automotive
- Electronics
- Heavy industrial machinery
- Medical device
- Oil and gas
Separately, the Direct Benefits Factor covers region-specific methods to compensate employees for irregular activities such as bonuses, payments to employees’ savings funds, payments in kind, etc.
The Social Insurance Factor accounts for country and regional social insurance expenses and labor-related taxes. This includes unemployment insurance, health insurance, retirement and disability pensions, payroll taxes, etc.
How to Calculate Direct Manufacturing Overhead Rates
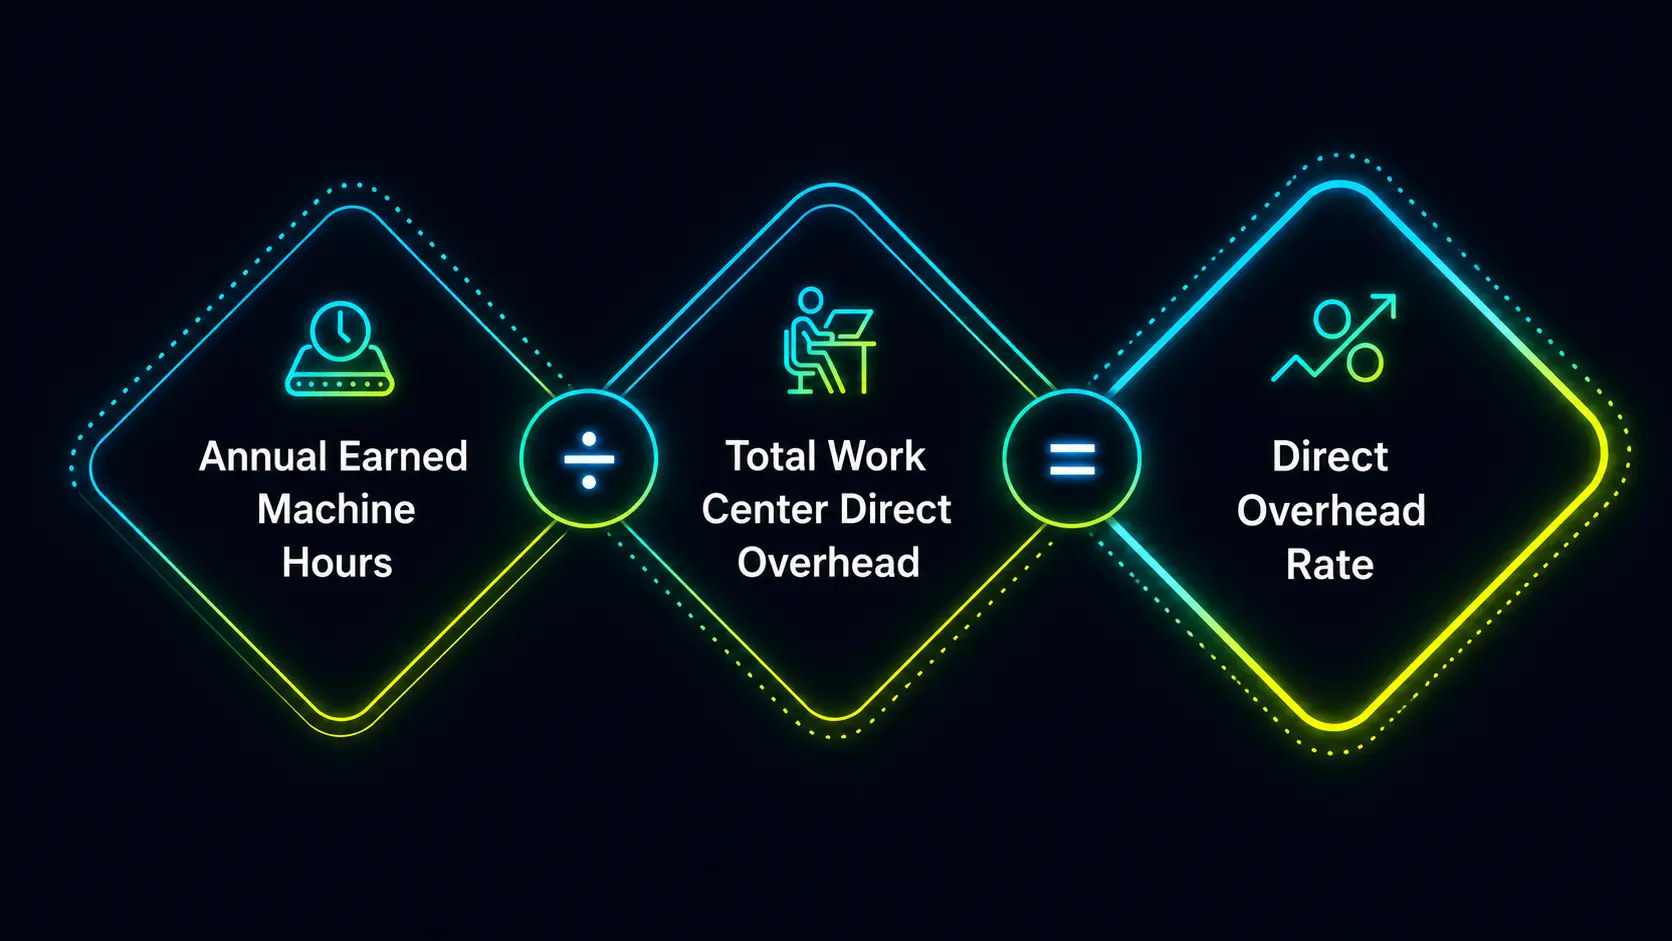
Here’s the formula to calculate the direct manufacturing overhead rates: Work Center Direct OH / Annual Earned Machine Hours = Direct OH Rate. Additional background and formulas to calculate direct manufacturing overhead follow below.
Note: A “work center” provides a distinct production process or operation in a factory area (e.g., drill, mill, heat treatment, etc.). Each work center has specific overhead costs, including machine depreciation, maintenance, and energy consumption. When calculating direct overhead for a work center, aPriori considers these factors for that specific location to provide precise cost estimations.
Work Center Direct Overhead (OH)
We use the following factors to calculate an annual work center budget and create an hourly rate based on the annual earned machine hours for the site. Here’s the breakout of each Direct Overhead factor:
- Machine depreciation includes the cost to buy and install the machine. aPriori applies straight-line depreciation during a 10-year period and assumes a $0 salvage value. Machine costs are obtained from the manufacturer, reseller, or other sources/comparisons.
- Imputed interest is the “assumed interest” on capital used to purchase machines, even though no physical interest is received.
- Machine maintenance for annual upkeep is commonly 3%-6% of the machine’s original purchase price. Estimated maintenance costs vary significantly by machine type.
- Energy production costs are calculated using the following formula: Annual Earned Machine Hours (see below) x Machine Power Consumption x Regional Energy Costs = Energy Production Costs.
- Machine power consumption is frequently included in the manufacturer’s spec sheet. Companies can also estimate power consumption by analyzing the energy usage of similar machines.
- Regional energy costs are available from regional and national organizations that track electricity rates.
- Annual supplies is an optional calculation/field for companies that want to track expenditures by facility with aPriori.
How to Calculate Indirect Direct Manufacturing Overhead Rates
Indirect OH is the sum of a Facility Budget plus a Support Services Budget (Facility Budget + Support Services Budget = Facility Budget). Definitions and additional background follow below:
The facility budget incorporates all annual costs associated with the factory, including insurance and utility costs (excluding the cost to run the machines). We estimate the facility budget amount apportioned to the work center based on the work center’s square footage, and we use regional commercial rental rates to assess the facility’s cost.
The support services budget tabulates the fractional “cost” of each support services employee to each relevant work center. For example, a quality worker responsible for 20 work centers would have 5% of the employee’s salary applied to each separate work center’s indirect overhead).
Raw Material Costs
Direct material costs can vary widely based on geography, quantity, etc. Please see the resources for manufacturing cost data for additional background.
2. aPriori’s Global Manufacturing Cost and Sustainability Libraries
aPriori’s Regional Data Libraries (RDLs) consolidate and standardize economic manufacturing data from multiple regions to standardize manufacturing practices and costs in each location. aPriori RDLs provide targeted economic data across 92 regions across North and South America, Europe, and Asia – including multiple RDLs in popular manufacturing regions including China, the U.S., India, Mexico, and Canada.
aPriori’s “cradle to gate” manufacturing costs include regional labor rates, manufacturing overhead, and material costs. aPriori’s RDL database is updated four times a year.
aPriori’s RDLs offer a valuable tool for executives seeking to navigate the complexities of global manufacturing costs. These libraries provide detailed, region-specific cost data, enabling more accurate and efficient cost analysis.
Importantly, aPriori also enables manufacturers to calculate estimated CO2e emissions associated with production. aPriori’s Manufacturing Insights Platform integrates with econinvent’s life cycle inventory (LCI) database to calculate both material carbon emissions factors and electricity carbon for each manufactured part based on its manufacturing processes and routine logic. The European Union’s “carbon tariff” underscores the financial importance of a robust carbon reduction strategy. Learn more about aPriori’s sustainability insights here.
Importantly, aPriori provides automation to compare the cost of manufacturing across the globe. Learn how to compare manufacturing costs quickly and accurately with aPirori’s digital factories.
Companies integrate RDLs into their digital factories to gain insights to advance their business priorities, including:
- Supplier Management: Use manufacturing cost estimates to benchmark supplier quotes, compare “build” vs. “buy” options, evaluate the impact of sourcing components or tooling in alternative regions or with new suppliers, and estimate the financial impact of design or manufacturing process alternatives.
- Profitability and Sustainability: Comparing total manufacturing costs across regions helps companies price their products competitively while maintaining profitability and addressing their sustainability goals.
- Strategic Decision Making: Accurate manufacturing cost and sustainability information support strategic requirements to address “carbon tariffs”, maintain supply chain resilience, and evaluate reshoring/friend-shoring (moving production to politically aligned trade partners).
- Budgeting and Forecasting: Use manufacturing industry cost estimates to develop budgets and track expenses against cost targets. And quickly compare labor and other costs by site or region to see how costs may change.
Watch our overview of Regional Data Libraries.
3. Resources for Manufacturing Cost Data
aPriori collects the following data quarterly to update its regional labor rates, manufacturing overhead, and material cost data. A list of data resources follows to help develop accurate estimates to calculate total manufacturing costs.
Resources for Regional Labor Cost Data
The primary source of Direct Wage and Social Insurance Factor data is the Kerkhoff Consulting Group. aPriori’s additional resources to augment trending economic information include the BLS, Eurostats, national statistical offices, and customer feedback.
aPriori’s Direct Benefits Factor includes data from the BLS, Eurostats, and global customer feedback across multiple geographies and industries.
Resources for Material Cost Data
The Kerkhoff Consulting Group is aPriori’s primary source for material price data. The aPriori cost modeling team also adjusts costs based on trending material rate pricing quoted by mills and large regional distributors.
aPriori also uses multiple additional resources to validate material rates, including:
- Current and historical material pricing data from OEMs and suppliers
- Public material commodity tracking sites, e.g., American Metal Market LLC, Plastics News Global Group
- Financial market resources, e.g., London Metals Exchange
- Relevant financial indicators, e.g., Dow Jones U.S. Iron and Steel Index (DJUSST), U.S. Aluminum Index (DJUSAL), and the Bloomberg European Steel Index (BESTEEL: IND)
- Supplemental industry resources, e.g., Gardner Intelligence and S&P Global’s Steel Business Briefing, track commodity exchanges, gather material price data, and provide market forecasts.
4. Formulas to Calculate Manufacturing Costs
aPriori gathers overhead cost data from multiple resources and applies industry-standard formulas to calculate the cost of production based on projected manufacturing outputs (volume). A list of manufacturing cost formulas and background follows below.
- Annual Rent = Work Center Square Footage x (1 + factor for non-production factory space) x Annual Cost Per Sq Ft.
- Direct Overhead Rate = Total Work Center Direct Overhead / Annual Earned Machine Hours
- Facility Budget = Annual Rent + Insurance + Utilities
- Fully Burdened Labor Rate = Direct Wage x Direct Benefits Factor x Social Insurance Factor
- Imputed interest rate: aPriori uses imputed interest rate data from the World Bank and the Organization for Economic Co-operation and Development (OECD)
- Imputed interest: aPriori uses the standard formula published by the Fraunhofer Institute and RWTH Aachen University in Germany. Annual Imputed Interest = (Total Machine Cost + Salvage Value) / 2) x Imputed Interest Rate
- Insurance = Annual Rent x Risk Factors (e.g., fire factor + loss factor + liability factor)
- Machine Utilization = Number of Hours a Machine is Running / Total Number of Available Hours x 100
- Square Footage of the Work Center = Machine Length x Machine Width x Allowance Factor
- Total Manufacturing Cost = Labor Costs + Manufacturing Overhead + Direct Materials
- Utilities = Annual Rent x (Electric Factor + Heat/Gas Factor + Water Factor) Note: Factors are represented as a % of annual rent
5. Use Regional Manufacturing Cost Insights to Your Advantage
A comprehensive supply chain cost analysis requires visibility into all costs, not just the apparent ones. This analysis should include internal costs absorbed by the organization, which can significantly affect supply costs and your bottom line.
For manufacturing companies, accurately evaluating total manufacturing costs across global economies is essential to maintaining competitiveness. Leveraging tools like aPriori’s Regional Data Libraries can provide valuable insights to compare where and why production costs differ among Italy, Indonesia, Taiwan, South Korea, and countries in between.
Understanding and analyzing supply chain costs, identifying cost drivers, and implementing strategies at various levels are crucial steps toward achieving cost savings and operational excellence in a competitive business environment.
Moving forward, aPriori will develop a new blog post to correspond with each RDL update. The blog will highlight manufacturing cost trends based on our insights, spotlight how manufacturers are using our RDLs and digital factories to unlock additional value, and include our latest updates.


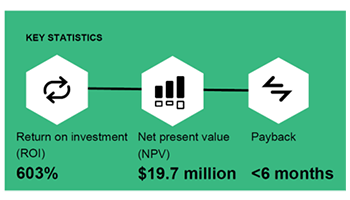
Get a 600% ROI with aPriori
Read the Forrester Total Economic Impact Report to learn how aPriori can cut costs and drive growth.Download the Study