Resources Hub


Design for Manufacturing Examples: Real-Life Engineering Case Studies

Abe Chaves
— April 18, 2024
Listen to this Article
1×
00:00
00:00
Key Takeaways:
- More than 70% of a part’s cost can be locked in during the early design phase
- Adopt a robust DFM process using digital manufacturing simulation tools to address cost, sustainability, and innovative design iterations simultaneously
The Full Article:
Typically, more than 70% of a part’s cost is locked in once its design is finalized. And at that point, manufacturing and sourcing teams have limited options to optimize part costs. That’s why cost modeling is exponentially more effective during the design phase. Product engineers need the ability to identify viable, cost-effective design alternatives while a project is still on the drawing board. This approach empowers design teams to innovate without sacrificing time to market or profit margins.
70% Product Cost is Locked in During the Design Phase
We explore this topic in greater detail by examining real-life examples to illustrate a key DFM principle in action. This includes why spreadsheets and other tools that rely on historical estimates provide a static, incomplete view of costing data – and how you can overcome this challenge with solutions that link design decisions to cost outcomes. Areas addressed include:
- The Design for Manufacturing (DFM) Imperative
- Overview of Important Cost Categories
- DFM Success Stories: Identifying Cost Inefficiencies
- Hidden Material Cost Drivers
- DFM Material Conversion Cost Example
- Other Methods for Cost-Effective Design for Manufacturability
- Learn More About the Power of Digital Manufacturing Insights
1) The Design for Manufacturing (DFM) Imperative
What if engineers had precise, design-level guidance on key cost drivers for their new product designs? And what if they had the insight to see how the cost is being affected by raw materials, conversion (i.e., the cost of turning raw material into a part), routing, and other manufacturability issues?
Having access to this capability would provide design and cost engineers with guidance to revise parts for added cost efficiency during the design phase. aPriori’s Manufacturing Insights Platform offers a solution that enables organizations to achieve this objective.
Unlike traditional spreadsheets, aPriori automatically evaluates the geometry of 3D CAD models whenever they are checked into a product lifecycle management (PLM) system. Through this software functionality, engineers gain real-time cost insights for parts and sub-assemblies, improving design and sourcing decisions.
Moreover, aPriori provides teams with a deeper understanding of the complex factors influencing part costs. The software is also equipped with cost and process modeling capabilities, enabling engineers to configure and run various scenarios. As a result, teams can seamlessly compare a part’s material, supplier, regional expenses, and more to make informed decisions.
To understand the impact of advanced manufacturing cost modeling, it’s helpful to consider the factors that contribute to a part’s final cost. Below, we break down a few key categories of part cost. The specifics may vary greatly, but these basic cost categories apply whether the part in question is sheet metal or plastic, cast or machined.
2) Overview of Important Cost Categories
Direct + Variable Costs:
The powerful interaction between each choice in the direct/variable cost category is significantly important. While engineering decisions may have an impact on period costs in the long run, we will focus on direct costs, as they often have the most substantial impact. The following categories describe the expenses associated with the marginal cost of producing each additional part.
Key Drivers of Material Costs
- Material type
- Material stock size (standard or non-standard)
- Material selection and utilization
- Special grain orientations (e.g., tight bends on a part may only allow manufacturing to orient the part in one direction when cutting it on the sheet)
Key Drivers of Overhead and Labor Costs
- Cycle time to make the part. Note: more than one machine may be used to make a part.
- Number of times that the part must be set up – whether in one machine or multiple machines
- Type and size of machine(s) that will be used to make the part
- Any secondary production processes such as paint, heat treatment, etc.
Indirect/Period Costs:
These costs matter for overall profitability but aren’t necessarily immediately impacted by marginal production changes. For instance, a factory will have some base level of maintenance costs regardless of the number of parts being made within a given period. These costs must be associated with specific supporting functions and spread across all parts produced.
Key Factory-Related Cost Drivers
- Energy costs
- Heating and cooling the plant
- Cleaning and maintenance
- Purchasing, manufacturing, engineering, shipping and receiving, and other supporting business functions
Key Administrative Cost Drivers
- General management costs
- Sales, marketing, and business development expenditures
- Technology support (e.g., IT staff or services)
Capital Expenditures (CapEx) and Non-Recurring Costs:
- Examples include initial investments in productive capital such as molds, stamping dies, machining fixtures, weld fixtures, and more.
- The cost impact of capital expenditures will vary depending on the complexity of the part, number of cavities, number of parts over the life of the tool, etc.
3) DFM Success Stories: Identifying Cost Inefficiencies
We developed both case studies using aPriori’s digital factory capabilities, which involve simulated production based on modeling a part’s digital twin.
During the design stage, you don’t need the absolute value estimate to be exact; a good, reliable approximation will suffice. For instance, you may determine that 20% of the part cost is material and 65% is conversion cost. While these amounts may vary during final production, they can provide a useful guidepost for prioritizing cost optimization projects. This practice can help you save time by avoiding product design changes that will have minimal impact on cost.
Manufacturing insights can help engineers minimize time-consuming activities and work faster. This automation-driven platform can determine the most efficient manufacturing methodology through near-instant cost estimates for new design alternatives.
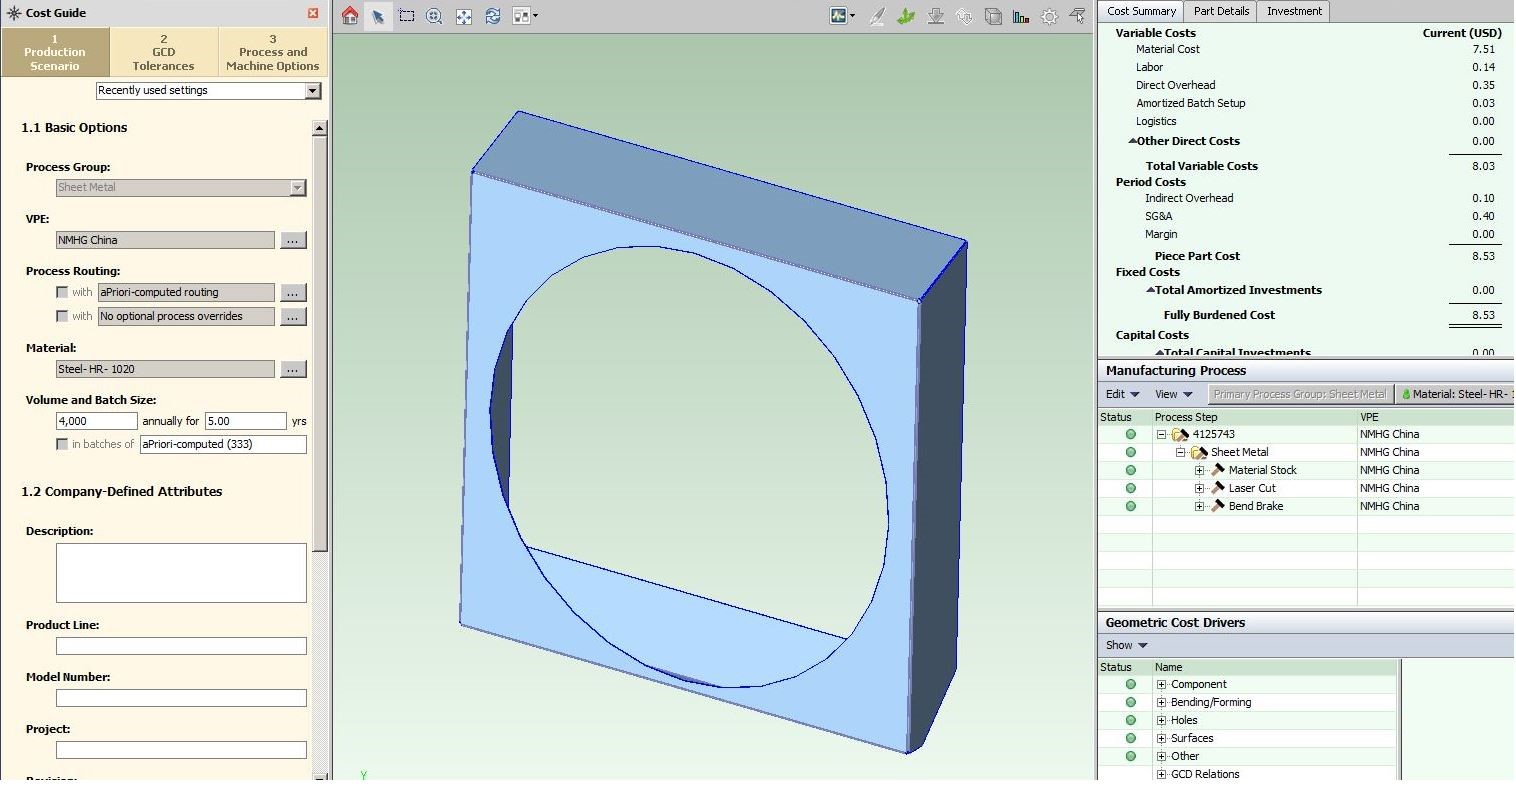
Material Cost Example One: Truck Sheet Metal Fan Cover Redesign
The following screenshot shows that 88% of the fan cover cost is material. To reduce material costs, you can:
- Select an alternative material that is cheaper (but still reflects functional load requirements and tolerances).
- Use less material by making the part thinner, adding ribbed forms to strengthen it, or improving material utilization to reduce waste.
The product developer recognized that the material choice was the primary cost driver and reduced the part size without altering the size of the opening or component mating points. The following screenshot displays his final solution.
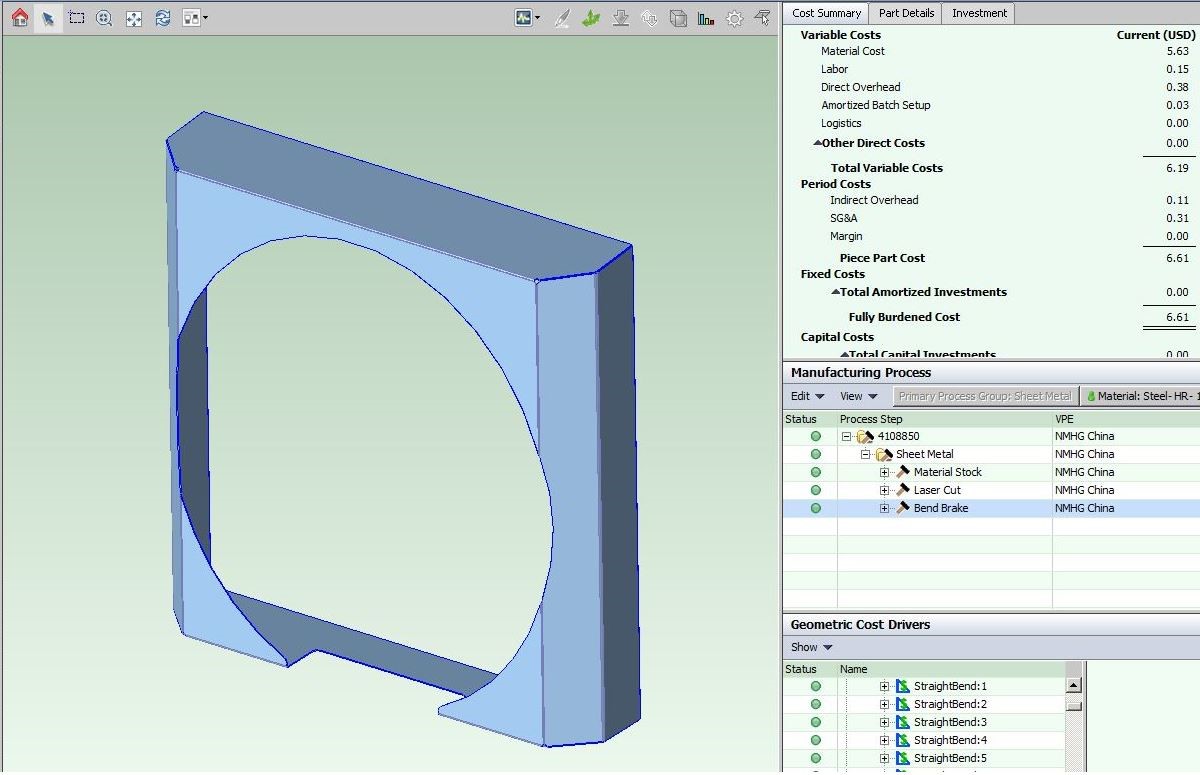
Note that while labor and overhead costs increased from $0.49 to $0.53, the material cost dropped from $7.51 to $5.63, saving $1.88 – which is a 25% savings. This improvement has paid for itself exponentially because the part is still used in tens of thousands of trucks.
This is a great example of how a reliable cost estimate is useful for prioritizing redesign work. A good cost vector (whether the cost is going up or down, by a little or a lot) is sufficient. For example, if the material cost dropped by only $1.50 instead of $1.88, the price reduction would still warrant a redesign.
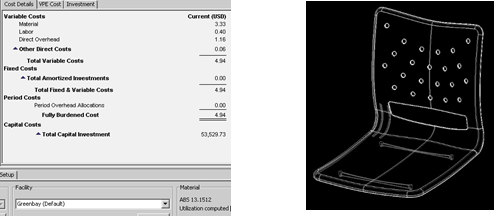
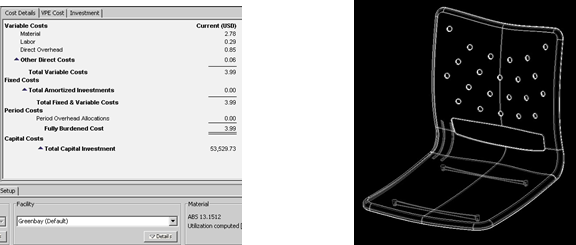
Material Cost Example Two: Plastic Seat
A manufacturer produces approximately 200,000 seats annually. The digital manufacturing cost model revealed that material is 67% of the total cost.
The engineer redesigning the seat has two options:
- Use lower-cost materials. Note: had the conversion cost been the most expensive, you may have wanted a material that cools faster, thereby decreasing the cycle time and production cost.
- Reduce the amount of material without compromising seat integrity.
The engineer tried several alternative designs, including:
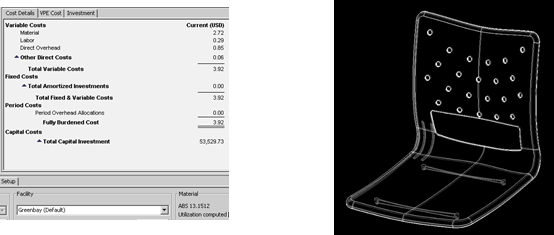
She began by reducing the thickness of the plastic from the top edge of the back of the seat down to 2/3 of the way and from the edge of the bottom of the seat to approximately ½ of the way to the middle of the seat. This change decreased the average thickness from 0.18” to 0.15”. It is critical to note that the cost of materials, labor, and overhead was also reduced. That’s because the thinner part cools faster, leading to a double benefit: a reduction in material and manufacturing costs, totaling $0.95 on a $5 component – a nearly 20% reduction.
The second design change made the back hole slightly larger from its original 5”–6” in height. However, because this change only shaved a few cents off the original cost, it was not worth the risk of potential quality issues or increased customer discomfort. The value of having real-time cost feedback “at the speed of design” enables you to catch these false starts far earlier in the process and maintain quality control by adhering to the principles of DFM.
4) Hidden Material Cost Drivers
- It is important to consider the tightness of the bend radius on a sheet metal part. One customer set the radii of all bends to the same value, irrespective of the part. For some parts, the radius was less than ½ the thickness of the part. I asked the manufacturing engineer if he had trouble meeting that requirement. He said, “No, we just make the bend radius larger. We know the intent of the design.”
- This approach worked until their factory became overwhelmed and started buying parts or sending them to another internal factory across the country. The parts became much more expensive because they needed to orient the components perpendicular to the bend, which limits the nesting flexibility of the part and requires more material. Simulated production software like aPriori can automatically identify if a bend is too tight and recommend a minimum bend angle.
- Sizing your parts just outside of standard raw material sizes can cost you a bundle. A Fortune 100 customer was designing a new flywheel for a larger version of a machine. Flywheels have a simple design, and the organization expected the latest cost to be proportional to the size increase. However, the price came in much larger, nearly 100%, rather than the 30% increase the company expected.
- The organization suspected an unscrupulous bid from a supplier. Still, upon review, it found that the supplier had to buy a special forging or start with the next size-up standard bar to meet the customer’s requirements. Either way, the cost would be disproportionately impacted. A diameter reduction of just a few millimeters fixed the issue, and the final design still had plenty of inertia margin.
5) DFM Material Conversion Cost Example
Let’s now move into conversion costs. Design engineers make choices that affect a large range of conversion costs, such as:
- Labor cost is proportional to cycle time. And the skill necessary to run the machine affects the wages of the operator. A 5-axis CNC machinist makes more than a 3-axis mill operator, for example.
- Set-up cost includes the number of machines to be set up and the number of times the part needs to be set up. Volume plays a large role in determining the per-product impact of set-up costs.
- Direct overhead cost is proportional to cycle time and the type and size of the machine.
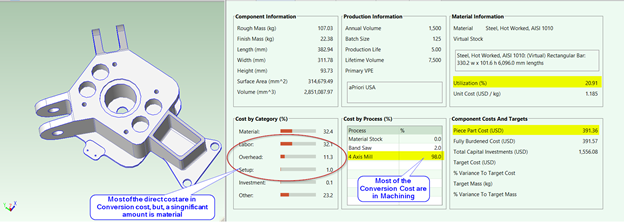
An engineer was assigned to reduce the cost for a part like the one below. A quick design review revealed a 40/60 split between material cost and conversion cost. This implies that there may be opportunities to contain costs on both sides of this split without impacting lead times.
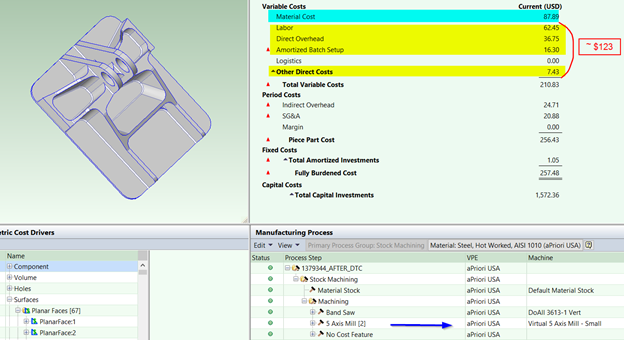
The engineer also noted that because this is a relatively low-volume part (300 units per year), it was being purchased as a machined part. While not very complex, the multiple slants on the surfaces were forcing this part to a 5-axis mill (rather than a comparatively cheap 3-axis mill).
The engineer had three choices to reduce costs:
- Redesign the part to reduce complexity for production on a cheaper machine
- Investigate machining costs further and address those issues in the design
- Identify alternative manufacturing processes for the part if they show promise
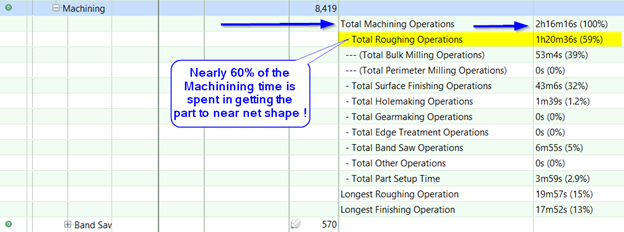
Using simulated manufacturing to analyze costs, the engineer discovered that the material utilization was only 11%, meaning that nearly 9 lbs. out of every 10 lbs. of material would be wasted. As expected, most of the cost of making the part was in machining, but from roughing operations, not finishing the part. This demonstrated that getting the part to near net shape was costing a lot in both material and manufacturing costs (see the figures below).
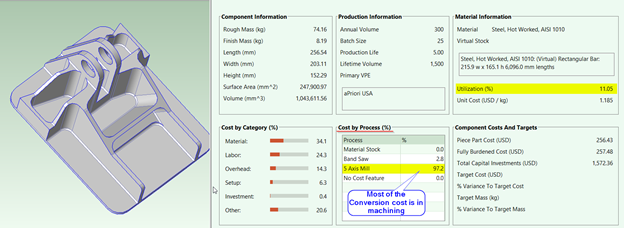
This part had been designated as a machined component because of the relatively low volume production of 300 units per year. However, based on this evidence, the engineer decided to investigate sand casting for the part. To see if it would be worth redoing the design and fatigue analysis to turn this into a casting, he created a cost estimate for sand casting the part.
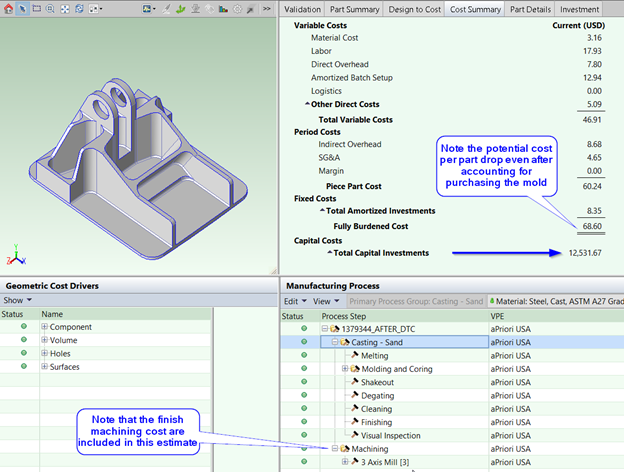
After analyzing the cost difference of approximately $190 per part on 300 parts, which amounted to a potential annual savings of $57,000, the component was redesigned and purchased as a casting, resulting in significant cost savings.
Alternatively, imagine that this part was not a candidate for a casting process due to load and fatigue requirements, as is the part below. The process for reducing costs for the part is similar, except that you need to explore machining costs (some parts may be extruded as well).
Consider how manufacturability issues may be costing you dearly. By evaluating the actual production methods intended for a part, manufacturing insights can identify design features that pose significant challenges. This could involve pinpointing a lack of draft angles, areas with excessive or insufficient thickness, or features that need a side action in plastic injection molding or die casting. For machined parts, issues like sharp corners, obstructed surfaces, or curved surfaces that require ball milling could be highlighted. Addressing these problems early can streamline production and reduce critical costs.
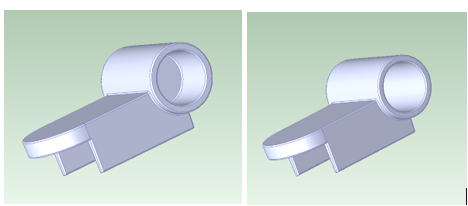
Looking at this part below, we notice a similar ratio of material to conversion cost. And we dig into the features that make it difficult to produce, as casting or extruding it is not an option.
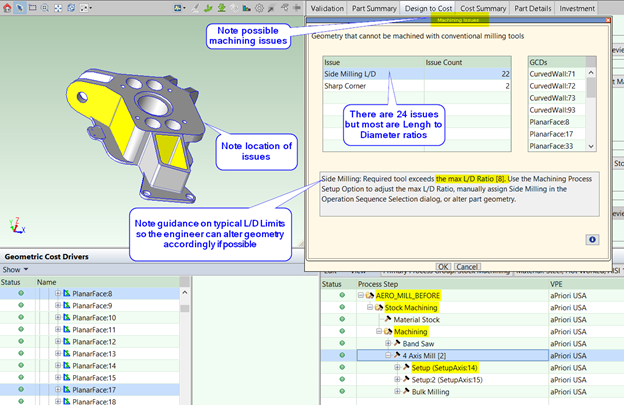
In the interest of time, we will limit ourselves to resolving as many of these L/D ratios as possible. The engineer realizes that the corner radius of those pockets is small, requiring a small tool diameter selection that violates customary L/D ratios and causes slower finishing times. He has the liberty to make those bigger, which won’t change the material consumed. See the figure below for the redesigned part.
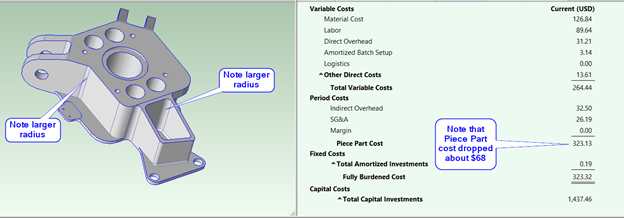
Larger corner radii allow for larger diameter selection, which increases the tool’s ability to reach further down without shaking. Cycle time drops, and cost goes down. A 17% cost reduction is certainly worth the effort of the redesign.
6) Other Methods for Cost-Effective Design for Manufacturability
It is possible to affect the size of a machine in manufacturing by considering the design of the part. For example, suppose a part is being produced in China, where labor costs are low, but overhead costs are high due to the use of large, expensive machines. In that case, it may be worth considering features that can influence machine selection.
The die-cast part below has a web in the middle that is not functionally necessary. This web is causing the part to require two-side cores, one on each side. If the web were removed, only one core would be needed, the mold base size would decrease, and the machine size (tonnage) would go down, causing a reduction in tooling and piece part cost with a smaller machine/lower overhead rate. Additionally, you may be able to have more cavities now, which is a big plus if this is a high-volume part.
The number of set-ups can dramatically affect the cost of a low-volume part. A hole that can’t be accessed from an already available set-up direction (aPriori can show you those) can cause an extra set-up.
Too many of these will require a more expensive machine, for example, forcing a move from a 3-axis to a 4-axis or 5-axis. Did you know that if your sheet metal part has an acute angle bend and an obtuse angle bend on the same part, then two bend breaks will have to be set up to make it? This may have minimal cost impact if the part is produced in large volumes, but if this is a low-volume part, it could create serious cost inefficiencies.
7) Learn More About the Power of Digital Manufacturing Insights
DFM is pivotal to identifying cost savings from the initial product design through material selection and manufacturing. By integrating aPriori’s advanced manufacturing insights, product engineers gain a deeper understanding of how seemingly small variables can significantly impact cost and other factors.
This approach provides product design and cost engineers with clear visibility and automated guidance to make informed decisions that enhance both product quality and profitability. The adoption of DFM best practices, supported by aPriori’s insights, can ensure that products are designed for performance, profitability, sustainability, and market success.
This post was originally published on Aug. 12, 2020, and updated on April 18, 2024.


Ready to Unleash the Power of DFM?
Check out how DFM analysis can improve a product’s manufacturability, cost, and sustainability.Access the Guide