Resources Hub


Evaluate Costs with Our New Product Material Cost Analysis Calculator

Lily Thomas
— September 26, 2023
Listen to this Article
1×
00:00
00:00
Key Takeaways:
- Global companies view raw material costs as a major threat to their supply chains in 2023
- aPriori solutions are embedded with a powerful algorithm that can estimate how much your product cost will change as material prices fluctuate.
The Full Article:
A KPMG survey revealed that 71% of global companies highlight raw material costs as their number one supply chain threat for 2023. It’s no surprise that manufacturers are determined to leverage all material cost reduction strategies.
We’ve got great news for you. We are now offering an informational-only demo calculator to test drive how you can conduct a material cost analysis. Full disclosure: This calculator does not represent all the output of aPriori products, which are highly sophisticated and leverage our manufacturing insights platform and digital factories for manufacturing simulation.
Here’s How It Works
We provide two examples of common manufacturing parts – Part 1 and Part 2 – to compare material rates. The Rough Mass and Manufacture Cost remain static in both parts because the weight of a part and the cost to convert raw material to a finished good do not change as the material unit price changes. However, the highlighted Initial Material Cost, Revised Material Cost, and the resulting Total Cost will change automatically based on your individual inputs for the Initial Material Unit Cost/kg and Revised Material Unit Cost/kg fields. In the aPriori products described below, calculations automatically will be pulled from your 3D CAD model.
Conduct your own material cost analysis demo, using our calculator. Hover over the information bubbles next to each field for more detailed explanations.
Comparing Material Costs Calculator
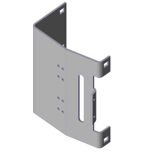
Part 1
Rough Mass:
Manufacture Cost:
Initial Material Cost:
Revised Material Cost:
Total Cost Initial:
Total Cost Final:
% Increase:
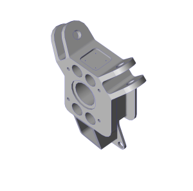
Part 2
Rough Mass:
Manufacture Cost:
Initial Material Cost:
Revised Material Cost:
Total Cost Initial:
Total Cost Final:
% Increase:
Why Material Unit Cost Impact to Total Cost Varies
The impact a change in material rate has on the total cost of a manufactured part will vary depending on the natural complexity and size of the part – even if you are using the same material. For example, let’s say a machine shop produces 30 stainless steel parts and the price of stainless steel is increasing by 20%. The total part cost will also increase by 20% if most of the part’s cost is material (Part 1). However, if a large portion of the part’s cost is in manufacturing (labor, overhead, consumable supplies, etc.) then its total part cost would be expected to change by less than 20% (Part 2). We are basing these demo numbers on U.S. costs and one can assume Part 1 and Part 2 are both made in the same factory.
aPriori’s algorithm estimates the optimal manufacturing routing, machines, and cycle times to determine the manufacture cost. Manufacturers can get labor, energy, and facility costs from 92 regions throughout the world.
The information bubbles next to each field offer additional insight. For instance, the rough mass information bubble explains that our algorithm calculates rough mass based on the final shape of the part, commonly available starting stock forms/sheet sizes, industry-standard machining and nesting allowances, and material density.
Explore our Regional Data Libraries to see how material rates vary from country to country.
The Benefits of Having a Material Rate Calculator Built into aP Design and aP Pro
Being able to get a more accurate barometer of your total initial material cost enables you to negotiate with suppliers more effectively.
Knowing your material cost to total cost ratio (factoring in all costs so you can anticipate the fully burdened cost) can help determine the feasibility and profitability of making that part. Our aP Pro solution can calculate it. What’s more, being able to calculate these material costs is not simply a matter of rough mass multiplied by material rate. aPriori considers material overhead, SG&A, and profit as well.
By knowing the ratio of material cost to total cost for any product, module, or sub-assembly, you can gauge the exposure/risk of the component to material cost fluctuations. You can even investigate which sub-components have the most exposure, so you can determine if a redesign is required. It can be done by using the aP Analytics module of aPriori.
Manufacturers can edit material and/or labor rates in both aP Design and aP Pro. Within aP Design, the material vs make costs can be viewed. This feature underscores and clarifies what is driving the design costs. Then the design engineer can understand where to focus and redesign the product to reduce costs.
Identify and eliminate cost drivers at the point of origin with aP Pro.
Get Ahead of Costs and Supply Chain Issues with Material Rate Forecasting
Manufacturers can get a handle on costs before production rather than reacting mid-production. Take a proactive approach to cost fluctuations.
Utilizing aPriori’s solutions will keep costs under control without sacrificing product quality. Watch our demo video to see how tariffs can impact your profitability.


Product Costs Spiraling Out of Control?
See How Alstom Used aPriori to SaveRead The Case Study