Why is it Difficult to Compare Global Manufacturing Regions?
- Inflation
- Material Shortages
- Sustainability Mandates
These are just some of the reasons why it’s difficult to compare global manufacturing regions around the world.
aPriori’s Regional Data Libraries address this challenge by providing material and production costs across 87 regions worldwide, including multiple regions in China, India, Mexico, and the United States.
What Data is Included in Regional Data Libraries?
With each region, you can see detailed costs including:
- Labor rates
- Operating costs
- Carbon equivalent emissions.
How Do aPriori’s Regional Data Libraries Work?
Here is a demonstration of aPriori’s regional data libraries in action:
Step 1: Cost a Part
We can cost a part in every single one of aPriori’s regional data libraries, which comes loaded with labor rates, material rates, and factory and machining capabilities.
Step 2: Create a Cost Report
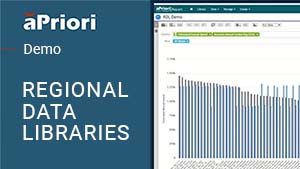
From this analysis, we create a report comparing annual spend in each region, which equals the unique regional cost multiplied by the annual volume.
Step 3: Compare Cost and Carbon
We can also see the carbon impact of making this part in regions across the world. The cost versus carbon report displays carbon equivalent, overlayed with annual cost. In the sample scenario in the video, the regions where the manufacturing cost is cheapest show high environmental impact.
Step 4: Compare the Best Factories Side by Side
Next we can compare detailed scenarios side by side. In the sample scenario in the video, we look at a region in India that is low cost and high carbon, compared against regions from the middle of the spectrum, like Hungary and Romania, along with a region that’s high cost like US North Central.
We can see the breakdown of cost in each region, with the specific materials rate, labor rate, direct and indirect overhead, and tooling cost. We can also see our carbon impact broken down into materials, processes, and logistics. In this comparison, we see that India has the lowest cost, but it has a higher carbon equivalent than a region in the united states. If we want to minimize both cost and carbon, we could choose a facility in Eastern Europe that has a low carbon output and a “middle of the road” cost impact.
The models can be adjusted by industry, with options ranging from aerospace to consumer electronics. And with quarterly updates, you’ll have the latest data to help reduce costs, manage your carbon footprint, and address supply chain risks.
What Can You Do with Manufacturing Insights?
Regional Data Libraries are a central part of the aPriori Manufacturing Insights Platform.
Customers use Manufacturing Insights to:
- Evaluate multiple regions simultaneously
- Determine how changes will impact cost, carbon, and time to market
- Assess suppliers
- Get the most out of supplier negotiations.
To learn more, visit the Regional Data Libraries page, or get help from an aPriori expert today.


