Budgeting for 2026: A Step-by-Step Guide to Smarter Supply Chain Forecasting with aPriori
Key Takeaways
- Traditional budgeting requires multiple tools for spend analysis, forecasting, and action planning
- aPriori consolidates these steps into a single platform, eliminating manual handoffs and fragmented data
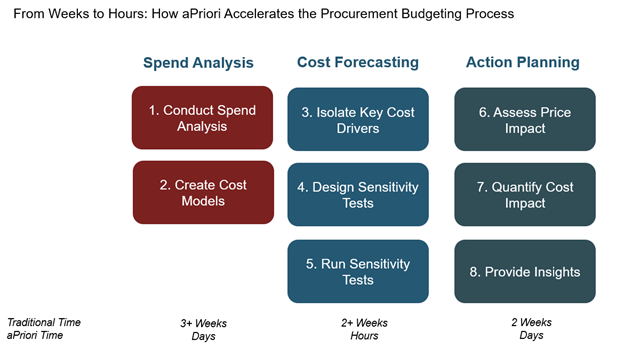
- aPriori eliminates time-consuming data prep and spreadsheet consolidation, automating key steps like classification and should-cost modeling, and providing actionable insights and supply chain forecasting in hours instead of weeks
The Full Article
Budgeting season often feels like a race against the clock. Procurement and sourcing teams need to dig deep into spend data, model cost scenarios, and deliver actionable insights — all while juggling supplier negotiations, internal alignment, and shifting market conditions.
Every year, sourcing and procurement teams enter budgeting season with a common mission: identify cost savings, prepare budget and supply chain forecasts, and set the right priorities for the year ahead. In theory, this process seems straightforward. But in practice, it’s a maze of disconnected systems, manual handoffs, and slow data consolidation.
Is Your Budgeting Process Aligned with Your Organization’s Broader Financial Strategic Planning?
While many organizations refer to this as the “budgeting process,” it’s really a cycle of three core activities:
- Spend Analysis – Understanding where the money went and where the biggest opportunities lie.
- Cost and Supply Chain Forecasting – Anticipating next year’s costs based on should-costs, market conditions, and future demand.
- Action Planning – Defining and prioritizing the initiatives that will deliver savings and mitigate risk.
This process is critical because it feeds directly into the company’s broader financial strategic planning cycle — but it’s also time-intensive and data-heavy. Teams face challenges such as:
- Data complexity – Spend and cost estimate data is often scattered across ERP, PLM, and supplier systems, requiring time-consuming cleansing and classification.
- Market volatility—Commodity price fluctuations, supply chain disruptions, labor costs, and exchange rates complicate market research and quantitative forecasting methods.
- Cross-functional alignment – Savings opportunities often require engineering, operations, and supplier buy-in.
- Manual analysis – Building cost forecasting models, running scenarios, and quantifying impacts often happen in disconnected spreadsheets, which impedes decision-making.
In short, traditional workflows, each of these steps is handled in different tools — creating friction, delays, and a constant risk of data inconsistencies. aPriori consolidates all three into a single platform, delivering faster, more accurate results without the inefficiencies of system switching.
With aPriori, those same steps happen faster, with data-driven forecasting accuracy, and all within one platform — so you can spend less time wrangling spreadsheets and more time making strategic decisions.
In this blog post, we will explore each step in more detail and outline how aPriori supports it.
Stage 1- Spend Analysis
Spend analysis should be the foundation of the budgeting process — but for many sourcing and procurement teams, it’s a marathon of data gathering and cleansing before any real analysis can begin. Supplier information lives in SRM tools, purchase histories sit in ERP systems, and category breakdowns might exist in yet another BI platform. Merging these datasets requires manual exports, endless spreadsheet formatting, and coordination across multiple stakeholders, some of whom may be responsible for like parts within different regions. However, it is not real-time data because preparation time lags often outdate it quickly.
Steps:
- Conduct Spend Analysis
- Create Cost Model
Traditional Approach:
Data is pulled from multiple systems, cleaned in Excel, and categorized manually or in BI tools. Category prioritization often involves back-and-forth emails and iterative spreadsheet updates, dependent on commodity managers’ expertise and historical supplier relationship inputs. This can take days or weeks before insights emerge.
aPriori Approach:
aPriori centralizes product and spend data, whether from uploading into CAD or integrating with enterprise systems within one platform, giving sourcing teams faster insights and clearer decisions. Classification, normalization, and Pareto analysis, or the 80/20 prioritization rule, are automated — producing actionable results almost immediately, without the lag from manual prep work.
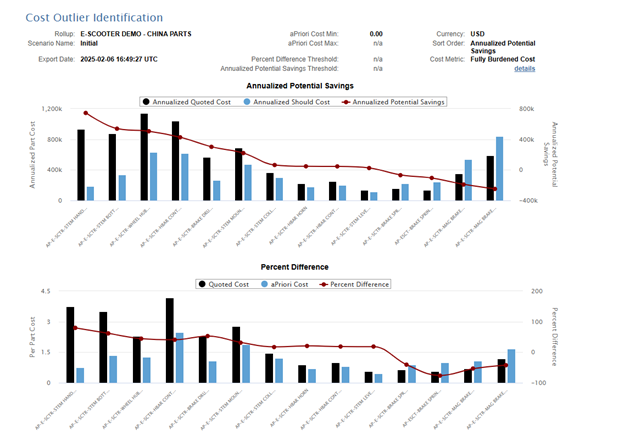
The cost outlier analysis can identify components with large gaps between what was quoted and what it should cost, providing more fruitful opportunities for cost reduction.
Stage 2: Cost Forecasting
Accurate forecasting of costs for the next year requires more than just historical data and last year’s spend — it requires accurate should-cost data, visibility into commodity price movements, and sensitivity testing to prepare for different market conditions. In most organizations, these activities are split across multiple tools: engineering software for cost modeling, subscription services for commodity pricing, and spreadsheets for scenario testing. Each handoff slows the process and increases the risk of version mismatches or incorrect assumptions, including scenarios where there is a lack of recent data.
Steps:
3. Isolate Key Cost Drivers – Identify the top 2–3 variables impacting your biggest spend areas (e.g., material prices, labor rates, overhead).
4. Design Sensitivity Tests – Build scenarios to see how changes in those drivers affect total cost.
5. Run Sensitivity Tests – Apply low-mid-high assumptions using market trends and supplier data to forecast a realistic range.
Traditional Approach:
Should-cost estimates are created in standalone tools or by engineering, discussions with suppliers or manufacturing engineering, typically lacking details and scenario testing, is done manually in Excel. Teams are forced to navigate multiple disconnected tools with inconsistent or outdated data, piecing everything together in spreadsheets or PowerPoint. For example, when running sensitivity tests, finding out how much material X supplier A is using—and how reliant the business is on that material—is nearly impossible to do quickly or efficiently. This fragmented process not only slows down planning but makes accurate risk forecasting nearly impossible. One wrong assumption can lead to poor sourcing decisions that ripple across the business—driving up costs, eroding margins, or exposing the supply chain to unexpected risks.
aPriori Approach:
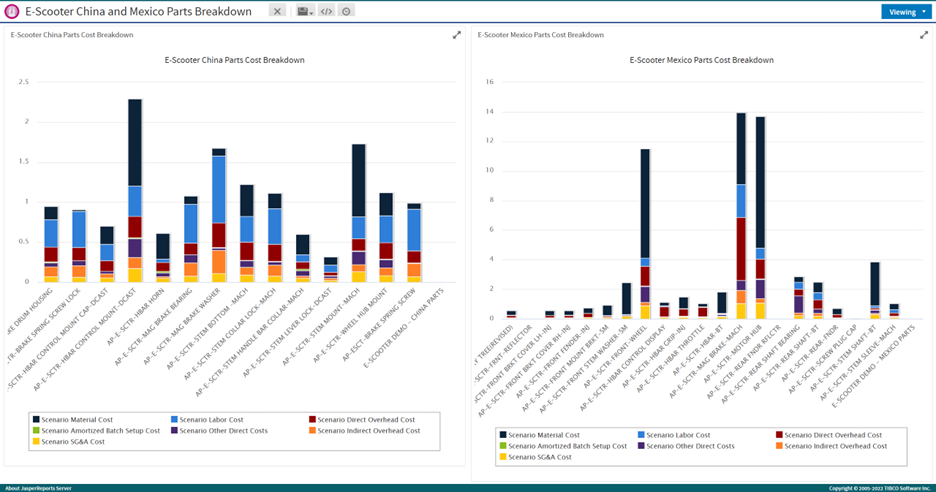
aPriori’s integrated manufacturing models automatically generate should-cost estimates directly from 3D CAD, while built-in commodity data feeds update pricing in real time. “What if” scenario testing happens within the same environment, eliminating tool switching and manual data entry, and quoted costs can be compared region by region using Regional Data Libraries. Beyond this, aPriori enables macro-level analysis across products or supplier portfolios, making it easy to see cost breakdowns by cost driver or commodity. This creates a reliable foundation for demand forecasting and risk assessment, helping sourcing teams avoid costly mistakes and make confident, data-driven decisions.
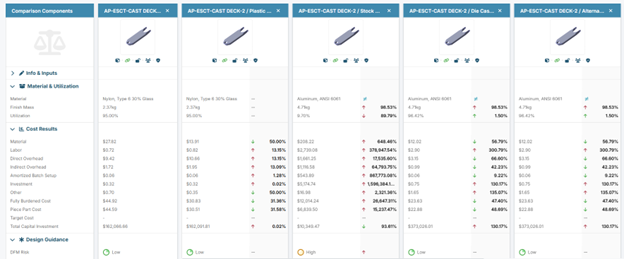
Create ‘what if’ scenarios across regions, materials, manufacturing processes and more to identify the best cost options.
Stage 3: Action Planning
Once spend data and forecasts are in hand, the final step is to quantify the impact of potential projects and upcoming price actions, aligning them with business priorities. Traditionally, this is where teams multiply quantities by forecast estimates, summarize savings opportunities, and prepare recommendations for leadership. But with insights scattered across different formats, systems, and regions, creating a single, accurate view requires additional hours of consolidation and validation.
Steps:
6. Assess Price Impact – Compare forecasted costs against the previous year to measure product price variance.
7. Quantify Cost Impact—Multiply price changes by volumes and time periods to determine exposure or savings.
8. Provide Insights – Turn the analysis into actionable recommendations, linking them to specific sourcing strategies, supplier negotiations, or design changes.
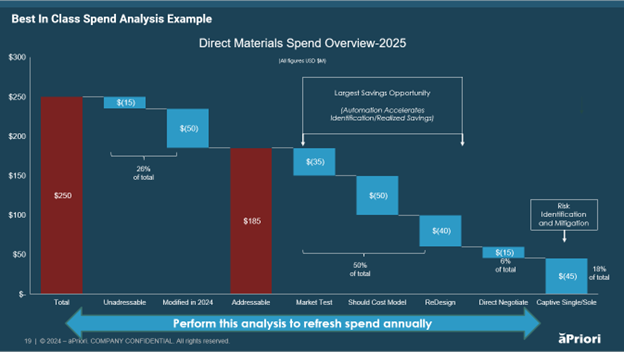
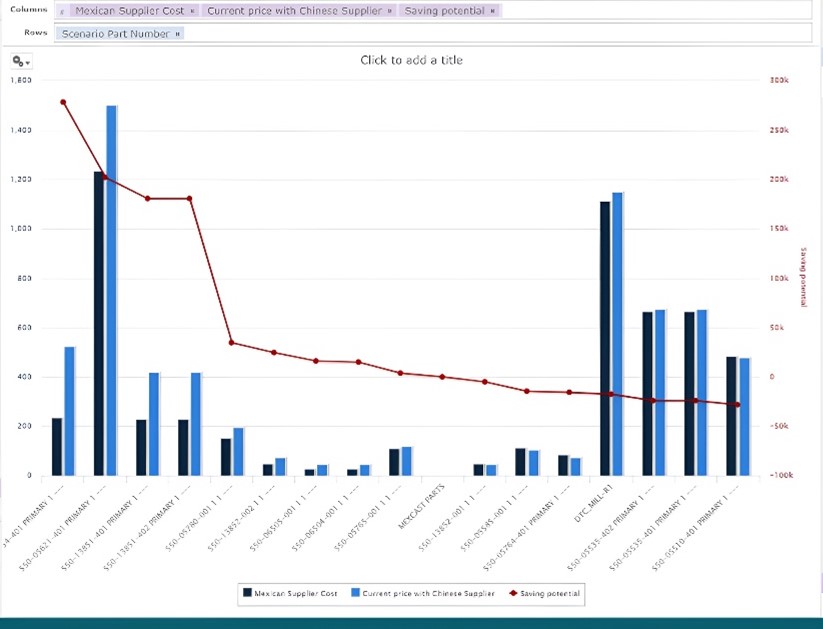
Following the spend analysis, teams can create a waterfall chart like this to support strategic planning and provide a clear, trackable view of the initiative’s impact.
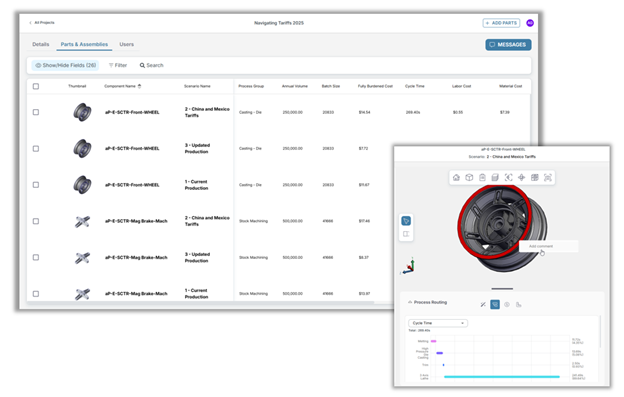
Once parts are identified for action, adding them to a project in aP Workspace facilitates clear communication and ensures full traceability across stakeholders.
Traditional Approach:
Results from analysis and forecasting are exported into Excel, then PowerPoint for final calculation and presentation. Collaboration and correction happen through email or shared files, and updates require manually re-running numbers and reformatting reports.
aPriori Approach:
With all analysis and forecasting already in the platform, aPriori’s algorithms instantly calculate cost impacts and generate insights ready for stakeholder review. Collaboration happens within the same environment, ensuring everyone works from the same up-to-date data, optimizing costs, drastically reducing decision-making turnaround time, and improving supply chain management.
The result: the same depth of analysis, completed in a fraction of the time.
The Bottom Line
The traditional budgeting process in sourcing and procurement often involves juggling multiple systems, spending weeks on data prep, and risking outdated or inconsistent results based on the contributor. aPriori replaces this fragmented workflow with a single, integrated platform, turning a process that once took weeks into one that can be completed in hours, with greater accuracy, predictive analytics, and deeper insights.
With aPriori, you get a clearer, more accurate view of your costs. The platform’s integrated data and scenario testing capabilities help you make smarter decisions with greater confidence and build a more reliable, robust 2026 budget. When budgeting season arrives, speed and confidence are no longer a trade-off. With aPriori, you can have both.
Do You Know What Your Should Costs Should Cost?
Analyze costs at a granular level to get an accurate “should cost” of manufactured products


